


Heat Intelligence helps Aars reduce heat loss
“With Heat Intelligence, we can prioritise pipe replacement based on where it will have the biggest impact – and deliver the most value for money.” - Aars District Heating, Kasper Neve
The Challenge:
Poorly performing pipes lead to heat loss
To optimise heat utilisation, Aars District Heating aims to renovate rather than repair. Replacing poorly performing pipes reduces the risk of bursts and can lower the network temperature. The challenge was to assess and prioritise where to act first, since the age of the pipes does not always predict their condition, which depends on varying and often unknown factors. Until now, the utility lacked the tools that help determine which pipes needed replacing and when.
“We can’t simply replace 50 km of pipes at once. Knowing where the performance is poorest compared to what it should be is the big challenge,” says Kasper Neve, Engineer at Aars District Heating.
The solution:
Heat Intelligence pinpoints problem pipes before it’s too late
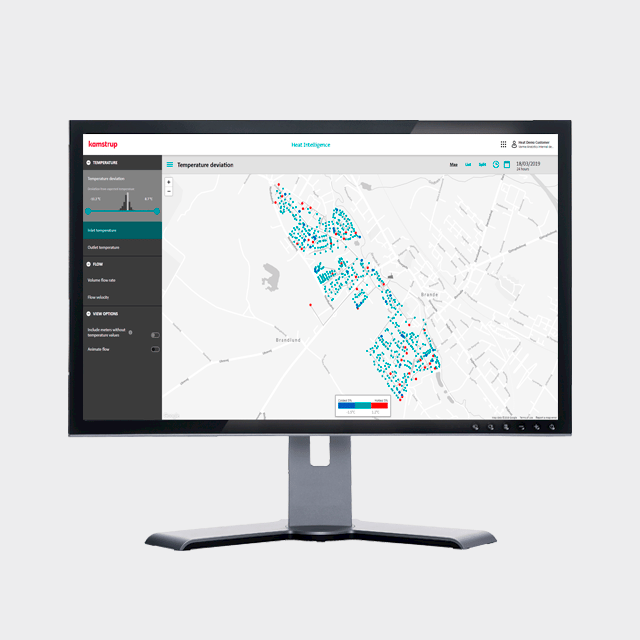
The Heat Intelligence analytical tool combines data from the heat meters with facts about the pipes, including length, dimension and insulation to calculate temperatures, flow and deviations. The tool helped Aars dramatically reduce its number of bypasses, lower return temperatures by 1.5oC in some areas and reduce annual heat loss by 7.8 MWh per customer, in a low performing area.

Discover more
How does Heat Intelligence help optimise heat across the network?
Thanks to Heat Intelligence, Aars is now able to prioritise renovations based on where they are most needed. Kasper Neve believes the comparison between the current state and the calculation model’s expectations makes Heat Intelligence a valuable tool in his day-to-day work.
From 200 to 16 bypasses
Kasper and his team focussed on bypasses, a common source of heat loss and increased return temperatur. They suspected that most of the bypasses in the distribution network were unnecessary and identified locations where the forward temperature was higher than it should be.
“The tool was able to identify the bypass locations where the forward temperature was higher than it should be according to the calculation model,” says Kasper.
Temperature deviations are often caused by a bypass near the meter. Here the utility could test the need of each bypass by turning it off — meaning that the number would go from roughly 200 to 16. As a result, this would lower the return temperature by up to 1.5 °C, in some areas, while also reducing the forward temperature.
7.8 MWh less annual heat loss per customer
Heat Intelligence also helped Aars identify an area in the network that was performing poorly. Temperature deviations in the area showed that temperature delivered to the customers was significantly lower than expected.
This was caused by the old service pipes’ wet insulation, caused by diffusion of water vapor over the years. With Heat Intelligence, Kasper Neve could identify the day in which each pipe was replaced. A comparison of forward temperatures before and after the renovation showed an increase of up to 10 °C and a reduction of the annual heat loss of 7.8 MWh per consumer.
10 °C unexpected heat loss in a few meters
Aars also assessed whether to invest in replacing the service pipes in certain areas earlier than planned. One address specifically showed a heat loss of over 10 °C from the street into the house. So, by replacing the service pipe the utility would deliver 10 °C more to the customer without producing more heat.
When the pipe was examined, it turned out that the massive heat loss was due to wet insulation caused by years of diffusion of water from inside the pipe. The coupler, joint and outer casing were all in perfect condition, and there was no water outside the pipe.
Kasper says he could not have found the problem with other tools. “A drone shows us actual bursts but it can’t tell me which areas are in the worst state. Thermography says nothing about the state of the pipes because soil conditions and depth affect the thermographic image more than poor insulation.”
Dig into the details of Heat Intelligence
Want to hear more about our Heat Intelligence tool?
Get in touch with our experts who can help you determine if it's the right tool for your heat loss challenges.

Let’s get the conversation started
How can we help you today?
.jpg?h=640&iar=0&w=640)
.jpg?h=640&iar=0&w=640)