


Heat Intelligence locates heat loss in the distribution network
How do you evaluate the condition of the underground pipes that make up your distribution network? A Danish utility validated their renovation effort in a specific area based on Heat Intelligence and found the hidden cause for a service pipe with an unexpectedly high heat loss.
With the legislative requirement for utilities to collect meter data at least 12 times per year, why not utilise this opportunity to make your asset management data-driven?
Recently, a Danish district heating utility looked into a specific area to determine if it would be worth their investment to replace the old service pipes sooner than planned (which they decided to do). The analytics platform Heat Intelligence showed a number of poorly performing pipes, including one that was particularly bad. According to the tool’s calculation model, on one specific address, an unexpectedly high heat loss from the street to the connected building meant that the temperature delivered to the end user was 10 degrees lower than it ought to be. Considering that an above-average consumer is expected to exploit about 40 degrees, losing 10 degrees in the service pipe is quite significant.
Wet insulation caused high heat loss
Once the service pipe was dug up and examined, it revealed that the insulation inside was soaking wet, and this was causing the abnormal heat loss. The pipe itself as well as the coupler, the joint and outer casing were all in perfect condition, but over time, water from inside the pipe had been diffusing through the pex.
At some point, the hot water had turned into steam molecules that started seeping through the pex and into the insulation. Here, it condensed, turning into tiny drops of water that slowly saturated the insulation like a sponge, so when the jacket pipe was cut open, this water poured out.
Today, most utilities use pex pipes with diffusion capes, which became available at the market around 2010. In other words, there are most likely many other service pipes with the same problem. Replacing all service pipes from a certain period in one go is not viable for any utility due to the immense costs and inconvenience involved. Also, a service pipe’s performance is affected by a number of other factors, including the operating conditions and the temperatures they are subjected to.
The challenge is therefore to prioritise the different areas in your network and handle the worst, first – but with everything buried under ground, how do you do that?

The right tool for the job
As there was no burst or leak of water outside the pipe, other tools could not have revealed the poor performance of the service pipe in this case. For example, airborne thermography will reveal where hot water runs out. However, what you can actually see will depend on many unknown factors like how far down in the ground the pipe is placed, the size of the pipe and the soil conditions. It can show you the actual forward temperature, but it won’t tell you if it is lower than it ought to be.
What enabled Heat Intelligence to detect this is the calculations it makes using smart meter data coupled with facts about the pipes, including type, length and insulation. The combination of several different data sources gives a more complete image of the condition of the distribution network that not only shows the current heat loss and forward temperature but also what it SHOULD be. This assessment provides the data-based foundation utility professionals need to decide where and when to renovate their network.
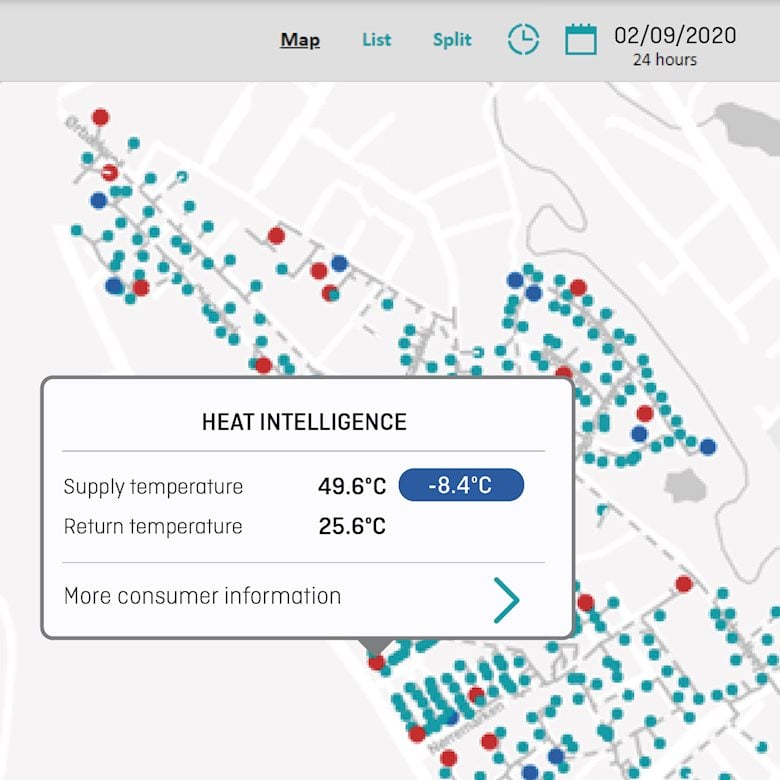
Heat Intelligence showed that in one particular service pipe, the forward temperature was 8.4 0C lower than it should be according to the Heat Intelligence model
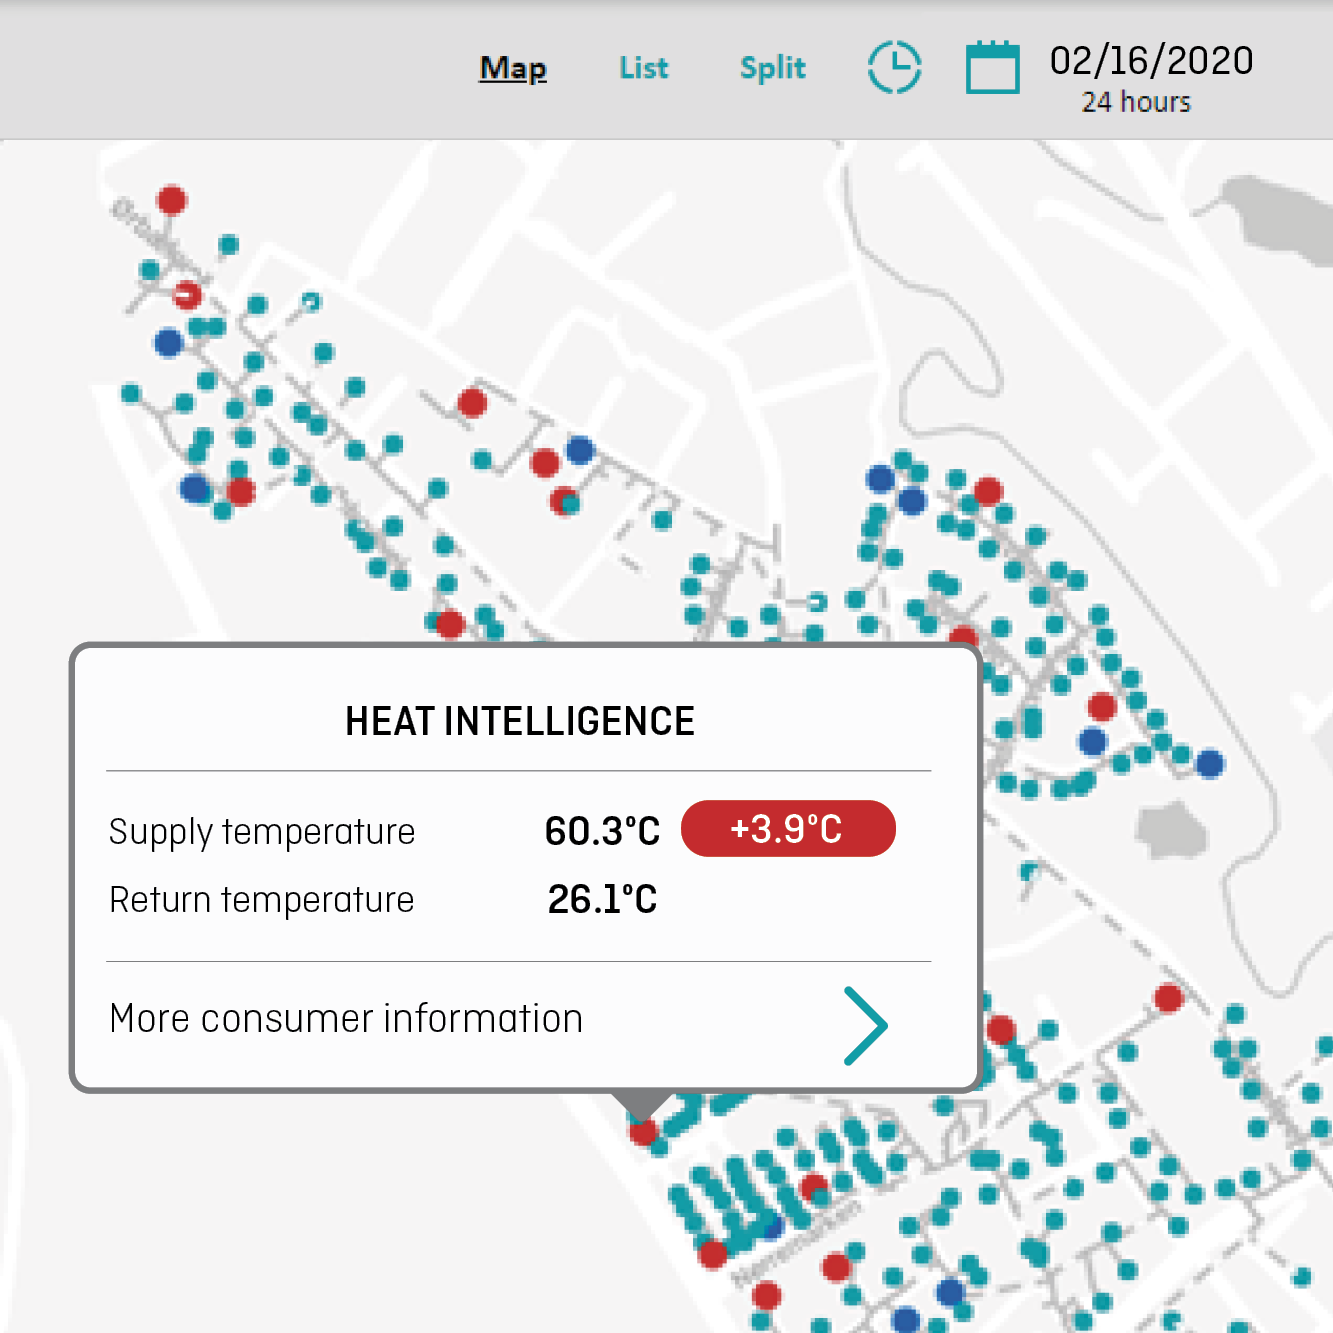
After replacing the old pipe, heat loss was back to normal, thus increasing the forward temperature by more than 10 0C. The slightly higher than expected temperature indicates that the pipe insulation selected was marginally better than the insulation value in the model.
Finding the weakest link
Ultimately, distribution network optimisation comes down to determining the weakest link in the chain. This is where your efforts and investment will have the biggest effect. In the case described here, the utility eliminated the 10 degrees of extra heat loss by replacing the service pipe in question. As a result, they now deliver 10 degrees more to this particular customer without having to produce more heat.
Targeted efforts like this are a key part of a utility’s continuous journey to optimise their network and lower forward temperatures. And while it is rarely an individual service pipe that makes the business case, the poorest performing pipes set the limit for how low the forward temperature can go. Low temperatures are a prerequisite to improving energy efficiency and integrating more sustainable energy sources. Also, reducing heat loss in the service pipes can deliver significant savings and enable a lower main temperature. But as this case proves, reaping those benefits starts with having the right tool.

Author
Product Manager Heat/Cooling
March 26, 2020
Author
Product Manager Heat/Cooling
March 26, 2020