Heat
District heating
Distribution network
Heat loss

Posted on Friday, January 4, 2019 by Morten Karstoft Rasmussen

Data located significant heat loss in the service pipes!

How a local district heating utility used data from intelligent meters to reduce heat loss and increase forward temperatures
Through close monitoring and together with the local district heating utility in Aars, Denmark, we were able to identify an area of the distribution network that performed particularly poor. The poor performance caused a drop in delivered heat by 10 °C. The renovation of the pipes in the area showed an immediate positive effect on the forward temperatures and has been estimated to reduce heat loss by approximately 7.8 MWh per consumer per year. 

Intelligent meters in the network deliver actionable insights
The poorly performing area of the distribution network was detected by aggregating data from the network’s smart meters in Heat Intelligence, Kamstrup’s analytics tool for district heating utilities. Heat Intelligence identified several outliers in the distribution grid, which are marked with blue circles in Figure 1. For all of these outliers a significantly lower temperature than expected was measured, given the higher temperature estimated in the branch pipe. In this case, the lower temperatures were caused by a very poor performance of the service pipe. Not only was this due to the pipe being relatively old; as it turned out later, the insulation was in a bad condition, too. 


Heat Intelligence calculates the expected temperature for all consumers, given the estimated temperature in the branch pipe. The difference from the expected temperatures for all consumers downstream relative to the point marked with the red star in Figure 1 are plotted in Figure 2. The chart shows that for all consumers a lower temperature than expected was measured; however, after renovating the pipes all temperatures “jumped” up close to zero (which is the expected value). It is even possible to tell on which day the service connections were renewed over the approximately two weeks period of renovation works.   

Figure 1. The blue circles indicate consumers with poor performing service pipes.

Figure 2. The deviation of forward temperatures for consumers downstream of the red star in Figure 1. Within a few weeks all temperatures settled around zero indicating that the service pipes had been renovated.


Reduced heat loss 
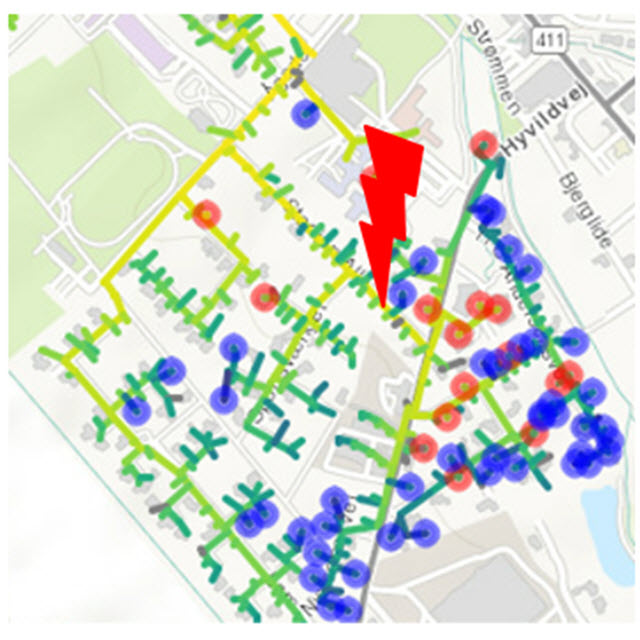
The increase in forward temperatures was achieved by reducing heat loss in the now renovated area of the network. For some consumers, the forward temperature increased by more than 10 °C. This, in turn led to a significantly reduced flow because more energy can now be utilized (higher temperature difference, T2-T1, requires a lower flow for the same amount of heat). Accordingly, the pipe dimensions could be reduced to a minimum thanks to the more efficient energy uptake by consumers. By comparing the forward temperatures before and after renovating the pipes, it is possible to calculate a heat loss reduction of approximately 7.8 MWh per year per consumer.*

Where to renovate next?
Naturally, many factors must be considered when making renovation plans: pipe age, leakages, need for more capacity, excavation availability and prices etc. In addition to identifying regions with higher heat loss, Heat Intelligence also delivers valuable insight in how to design and dimension new pipes.
 
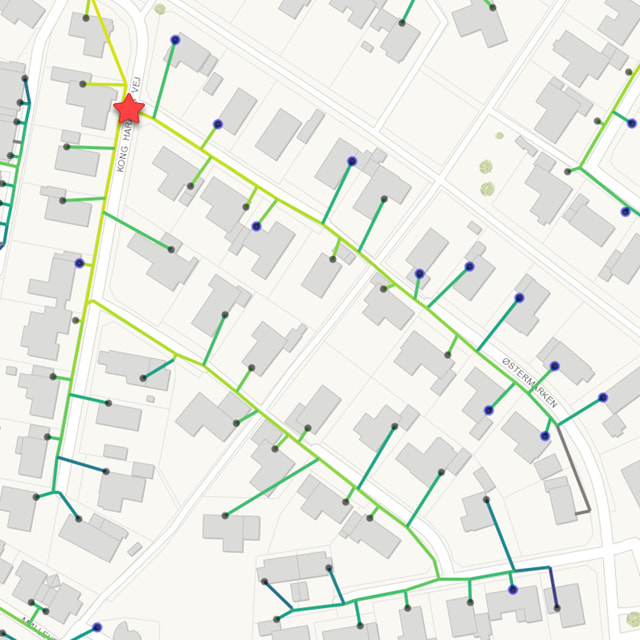
With Heat Intelligence, district heating utilities can easily get an overview of the actual consumption in the different areas of their network, i.e. the typical consumption of a specific branch, or if there are any bottlenecks in the system giving rise to high-pressure losses. 

Figure 3 shows another area of the network where Heat Intelligence has detected service pipes with high heat loss (marked with blue circles). In the same way as above, the estimated temperature deviations can also here be used to calculate the attainable reduction in heat loss.

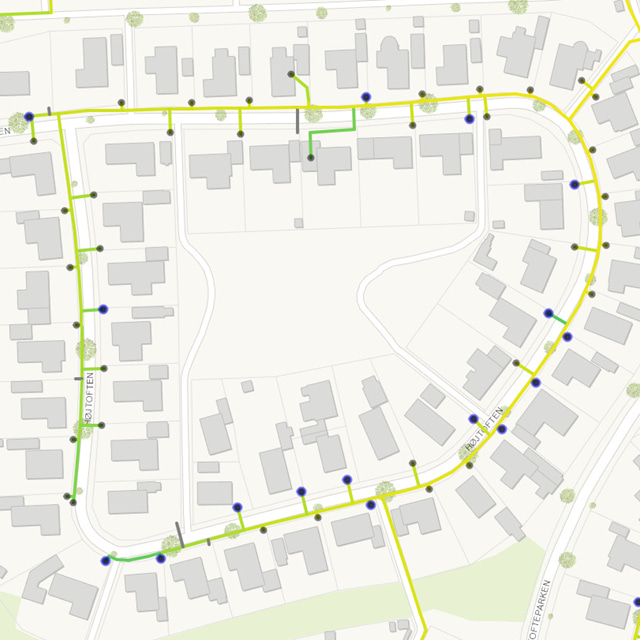
The temperature deviations identified by Heat Intelligence for the consumers marked with blue dots in Figure 3 are in the same order of magnitude as above, i.e. approximately 10 °C below the expected value. Consequently, it is also possible to obtain a reduction in heat loss by approximately 7.8 MWh per consumer per year in this region of the network. These findings should, of course, be taken into consideration when the utility plans for the next renovation.

Figure 3. Map showing another area in the network where heat losses are high (blue circles indicate where the temperatures are approximately 10 °C lower than expected). The calculated temperature deviations can be directly used to estimate the cost of the heat loss and should be taken into account when renovating the network. 


How does Heat Intelligence work?
Heat Intelligence continuously aggregates data from all meters located in the distribution network. Flow, pressure, forward and return temperature are inferred in all pipes in the network, using data from thousands of meters placed at the network end points. The measurements from the individual meters can then be compared to the network estimates to identify consumers that somehow act like an outlier, i.e. either too low or too high. If a meter e.g. measures a temperature much lower compared to the estimated value in the concerned service connection, it could indicate bad pipe insulation. If, on the other hand, a meter measures too high temperatures, it could indicate that a leakage is causing increased circulation.


Do you want to locate heat loss in your utility?

Learn more about our analytics tool, Heat Intelligence, right here.


_____________________
*In the present case, estimates are used based on average values from the 17 consumers in Figure 1. Heat Intelligence estimates the forward temperatures in the main pipe supplying the service connections for each consumer. Using these estimates, together with meter data, heat loss coefficients can be estimated before and after the renovation. It is estimated that, by renewing the service connections, the heat loss coefficient is improved with a factor 6.5. This translates to a difference in heat loss of approximately 1.1 W/m/K. Using approximate values for the service connection lengths, the supply and ambient temperatures as well as the consumption, this difference corresponds to a heat loss per consumer per year of approximately 7.8 MWh. 
This is a rough estimation - a more precise estimation of the heat loss per consumer per year requires a more careful analysis using data from each individual consumer and service connection.

Author


Related blog posts