
Posted on Thursday, September 12, 2019 by Kamstrup
Using data to determine the cause of earth faults
Potentially fatal earth faults in the distribution grid need quick and efficient handling, but determining the cause can be like looking for the needle in the haystack. Meter data from substations can provide some important clues that enable DSOs to take action much faster.
Active earth faults in the distribution grid is a serious and potentially dangerous situation which should be handled to improve safety for humans and equipment. In Norway this has led to regulatory demands for utilities to monitor and respond to earth faults.
Earth faults can vary a lot; some are long and some only last a second. Based on data from the utilities we work with, substations on average experience 4-5 earth faults each day and some stations have up to 1700 faults each day. However, finding the cause of an earth fault can be a tricky and very time consuming task. This is especially the case if the faults only occur at certain times during the day and week or if the substation in question is located far away from any service personnel or at locations that are hard to reach. Hour-long field visits searching for the needle in the haystack are not uncommon.
Therefore, the distribution grid operator needs a better and more efficient way of determining the cause of an earth fault. Measured data from the substations can make an important difference here and we think that using these data intelligently is the first step towards a faster and easier handling of earth faults. By looking at detailed information about the time evolution of the fault it is possible to understand the root cause of the earth fault and take the appropriate actions from the beginning.
Let’s look at some real-life examples. From meters located in substations spread across Norway we have observed several interesting earth faults, many of which could be very tricky to find and repair, if the service personnel did not know the time pattern and the measured voltages or current during the fault.
Consider a substation which has a periodic earth fault; it comes and goes as on the example shown above. This fault was related to street lights and therefore only present during the night time. If the service technician had not known this, he would have searched for the fault during normal work hours where there was no fault and his search would have been in vain. However, with the data showing the actual fault pattern, he knows when the fault is active and when to visit the substation. The experienced technician or operator could probably immediately recognise that the fault occurred in a daily pattern and only during night time which indicates that it could be related to for example street lights. This would have helped a lot.
In another case, a substation had many short earth faults that were always just 7 seconds long and occurred repeatedly. Such a pattern would suggest that this was probably related to a machine and not something irregular as human behavior.
Again, based on data a more qualified search for the fault was possible. Other substations show a semi-stable behavior with faults starting and ending around the same time of day and occurring most, but not all days. This indicates that human interactions are involved and this knowledge could be used to guide the search for the fault.
Earth faults occurring at end-users is a topic of its own. End-user faults may or may not be visible from the substation. However, if you could find the same fault pattern at the end-user and the substation, you would have a clear indication of where the fault might stem from. Being able to quickly visualise and compare earth fault data from end-users and substations will help the utility in finding the cause of some faults.
In Kamstrup we strive to empower utilities by visualising the data received from their substation meters and end-user meters. Thereby the utilities can make qualified decisions, save time, improve operations and increase safety for the end-user. We develop our tool in a co-creation process with utilities to make sure that we end up with an intuitive interface that provides them with an overview of their present and historic earth faults at all times and locations, both for the field technician and the grid operator.
Norwegian-speaking readers can read more about our tools for locating and determining earth faults here
Earth faults can vary a lot; some are long and some only last a second. Based on data from the utilities we work with, substations on average experience 4-5 earth faults each day and some stations have up to 1700 faults each day. However, finding the cause of an earth fault can be a tricky and very time consuming task. This is especially the case if the faults only occur at certain times during the day and week or if the substation in question is located far away from any service personnel or at locations that are hard to reach. Hour-long field visits searching for the needle in the haystack are not uncommon.
Therefore, the distribution grid operator needs a better and more efficient way of determining the cause of an earth fault. Measured data from the substations can make an important difference here and we think that using these data intelligently is the first step towards a faster and easier handling of earth faults. By looking at detailed information about the time evolution of the fault it is possible to understand the root cause of the earth fault and take the appropriate actions from the beginning.
Let’s look at some real-life examples. From meters located in substations spread across Norway we have observed several interesting earth faults, many of which could be very tricky to find and repair, if the service personnel did not know the time pattern and the measured voltages or current during the fault.
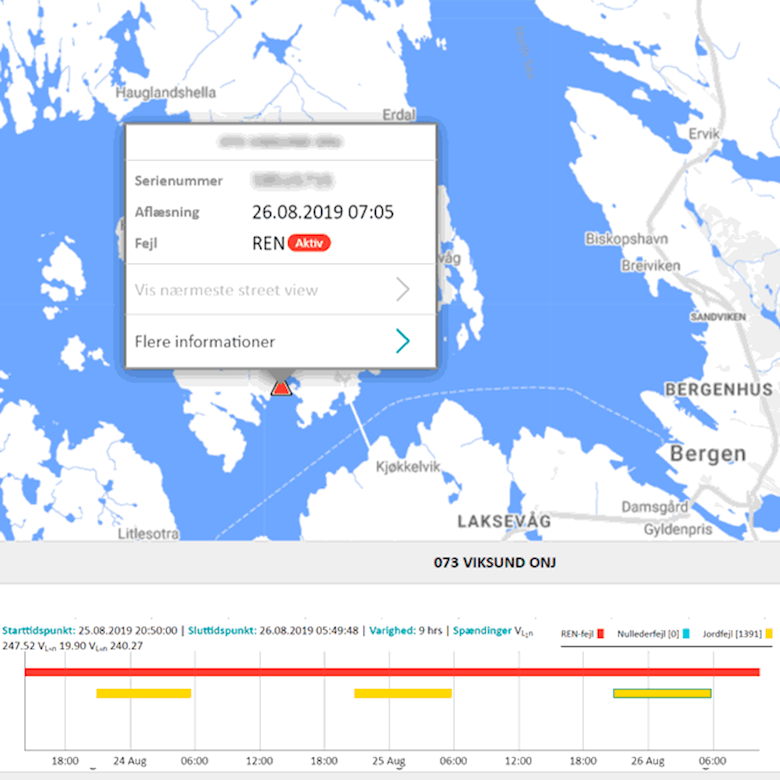
Consider a substation which has a periodic earth fault; it comes and goes as on the example shown above. This fault was related to street lights and therefore only present during the night time. If the service technician had not known this, he would have searched for the fault during normal work hours where there was no fault and his search would have been in vain. However, with the data showing the actual fault pattern, he knows when the fault is active and when to visit the substation. The experienced technician or operator could probably immediately recognise that the fault occurred in a daily pattern and only during night time which indicates that it could be related to for example street lights. This would have helped a lot.
In another case, a substation had many short earth faults that were always just 7 seconds long and occurred repeatedly. Such a pattern would suggest that this was probably related to a machine and not something irregular as human behavior.
Again, based on data a more qualified search for the fault was possible. Other substations show a semi-stable behavior with faults starting and ending around the same time of day and occurring most, but not all days. This indicates that human interactions are involved and this knowledge could be used to guide the search for the fault.
Earth faults occurring at end-users is a topic of its own. End-user faults may or may not be visible from the substation. However, if you could find the same fault pattern at the end-user and the substation, you would have a clear indication of where the fault might stem from. Being able to quickly visualise and compare earth fault data from end-users and substations will help the utility in finding the cause of some faults.
In Kamstrup we strive to empower utilities by visualising the data received from their substation meters and end-user meters. Thereby the utilities can make qualified decisions, save time, improve operations and increase safety for the end-user. We develop our tool in a co-creation process with utilities to make sure that we end up with an intuitive interface that provides them with an overview of their present and historic earth faults at all times and locations, both for the field technician and the grid operator.