Posted on Friday, July 13, 2018 by Kristan Rokkjær
The Smart District - Blog series part 2
Water balance and categorising water loss
A major challenge facing water utilities today is not having enough information about what’s going on in the distribution network. But there don’t have to be any secrets. At Kamstrup, we believe that a completely transparent distribution network and updated underground situational data are key to addressing this challenge. We want to share our vision and insight with you. Therefore, in this series, we move closer to the future in terms of Smart Districts (district metered areas) and inform you of solutions for minimising loss and optimising operations and – especially – product quality. In this second part of the blog series, we have a closer look at how a Smart District has a positive effect on your water balance and water loss categorisation.
Smart Districts and automated water balances
Sectioning the supply of drinking water into Smart Districts provides a basic opportunity to localise water loss in the supply grid. Getting continuous information on the water balance for each Smart District – by comparing measurements from a (district) meter placed on the supply branch to the consumption measured by the household meters within the district – provides an overview of the total water-loss in the supply grid as well as insight into how the water loss is distributed across the various districts. If you combine sectioning your distribution network into districts with smart, remotely-read meters you increase the value of those districts significantly. Frequent readings of household and district meters, which are possible when smart meters are used, makes it possible to generate water balances much more often than previously.
Categorising loss in Smart Districts
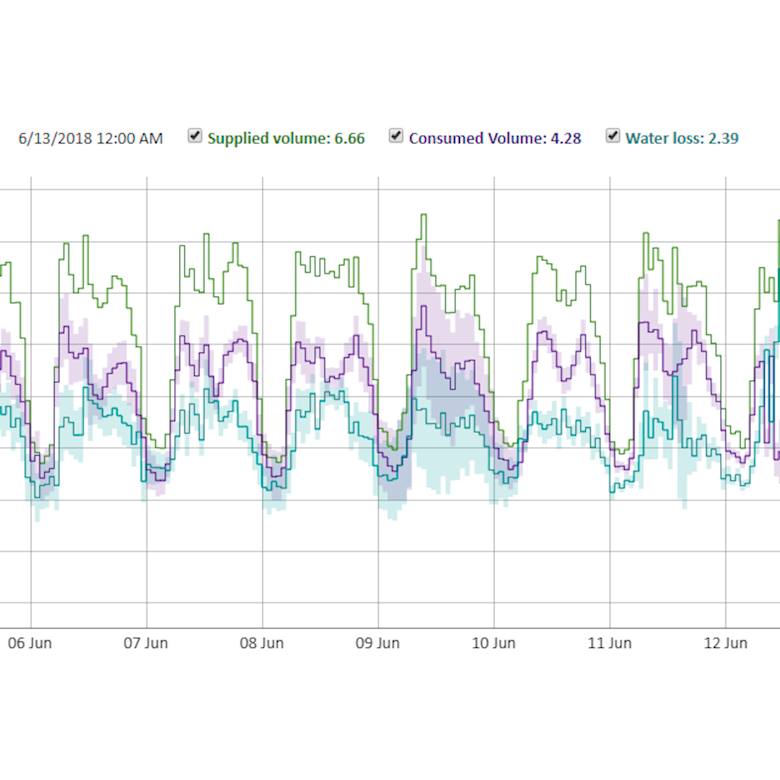
In Smart Districts, an experienced utility manager can often determine the type of water loss by comparing it with various other parameters. Water loss in Smart Districts where the loss increases along with the overall consumption is often caused by unauthorised unmetered consumption like theft, constructions sites without meters installed or if the district is supplying more consumers than assumed. On the other hand, the water loss in a Smart District with no correlation between loss and consumption is mostly caused by leaks on distribution mains and service connections. In the first instance, efforts to find installations with insufficient or no meters is far more cost-effective than a large-scale leak-detection process using devices such as mobile noise loggers. This way, the Smart District also contributes to fighting water loss.
Night-time consumption and automated water balances
The traditional method of categorising water loss in networks divided into districts is to use the district meter’s lowest flow in a given time period at night as a benchmark for the district’s water loss. This method has certain inexpedient features, however, compared to automatically generated water balances which are possible when using Smart Districts. In districts with industrial consumers that use large volumes of water at irregular times, the measurement is tainted to such an extent that it cannot be used to provide an accurate picture of loss in the district.
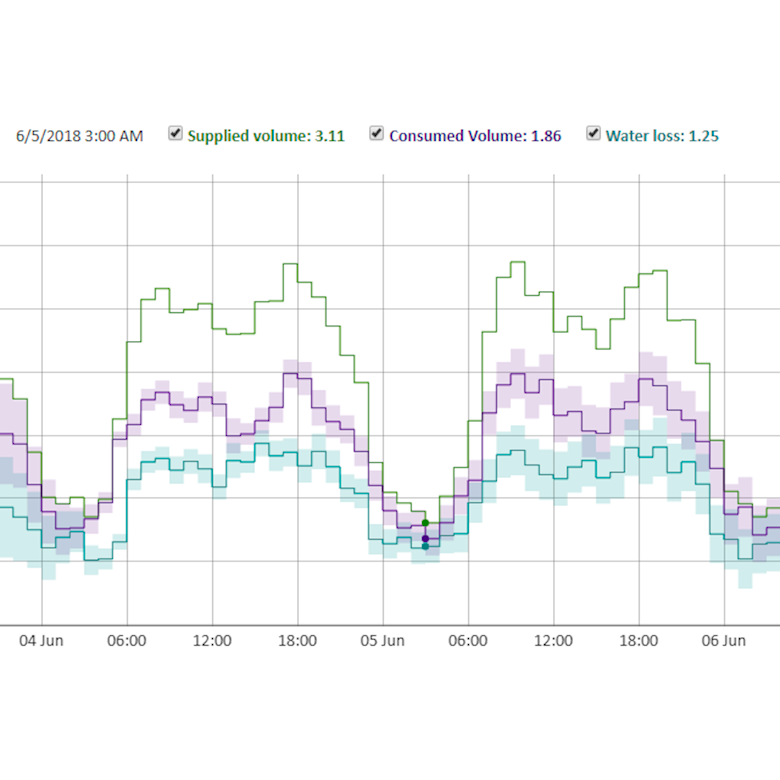
Moreover, the idea that you can estimate the total water loss based on a nightly measurement presupposes that the water loss is the same both day and night. As Figure 2 shows, this is not necessarily the case. Depending on what kind of water loss you are dealing with, it can fluctuate greatly at night compared to during the day. Nor can the method be used to identify the type of water loss, which is possible using the automated water balances generated in a Smart District. Therefore, water loss calculations are far more reliable if carried out on an hourly basis, instead of within a brief period of time at night.


