
Posted on Tuesday, February 11, 2020 by Kamstrup
Status report: Non-Revenue Water in numbers
Get an overview of the Non-Revenue Water in Northern Europe anno 2019
As the old year draws to an end and a new one begins, it is customary to look back and take stock. Today, I’d like to do just that and take a look at one of our industry’s main challenges: Non Revenue Water. Last year, we asked 37 utilities from Northern Europe about their Non-Revenue Water and I’d like to share the results with you all.
An important challenge
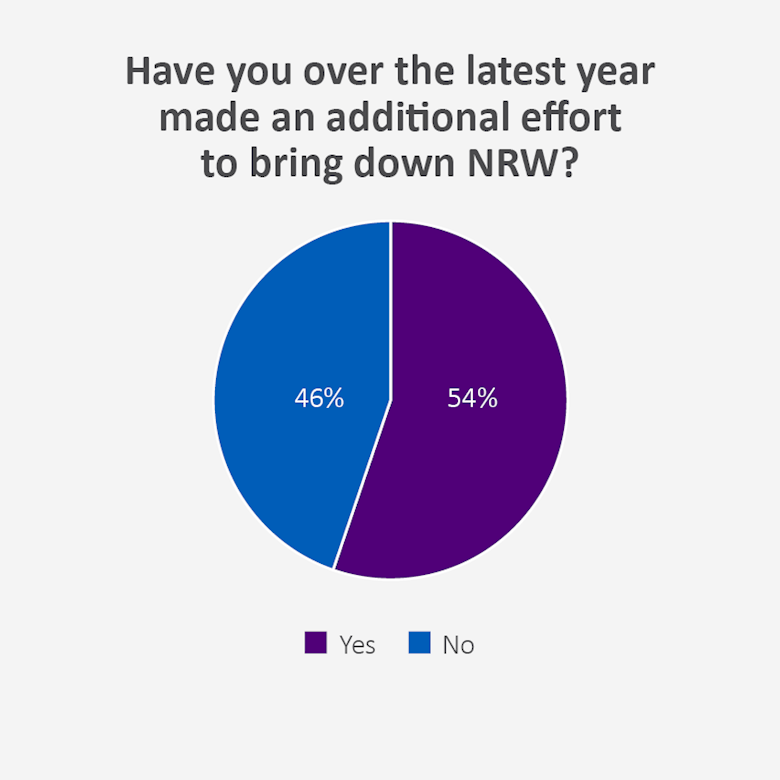
With the increase in attention towards sustainability brought on by, among other things, the SDGs, Non-Revenue Water is a topic the most water professionals have come across and it is something that most utilities work actively towards reducing. 54% of the utilities in the survey say that they have made additional efforts to lower their water loss, and almost all participants rate NRW reductions 5 or above on a scale of 1-10 with 10 representing the highest importance.
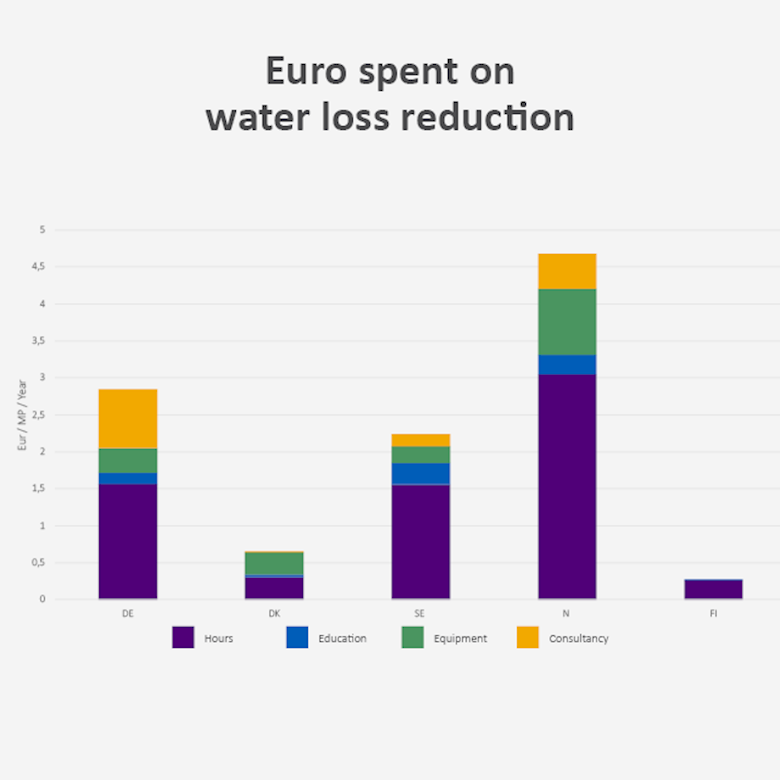
Aside from being seen as important, NRW is also something that the utilities spend both time and money on in the efforts to reach the lowest economically feasible levels. The participating utilities report spending between €0.3 and €4.6 per metering point every year in time spent locating leaks, education, external consultants and equipment.
Where are the biggest water losses?
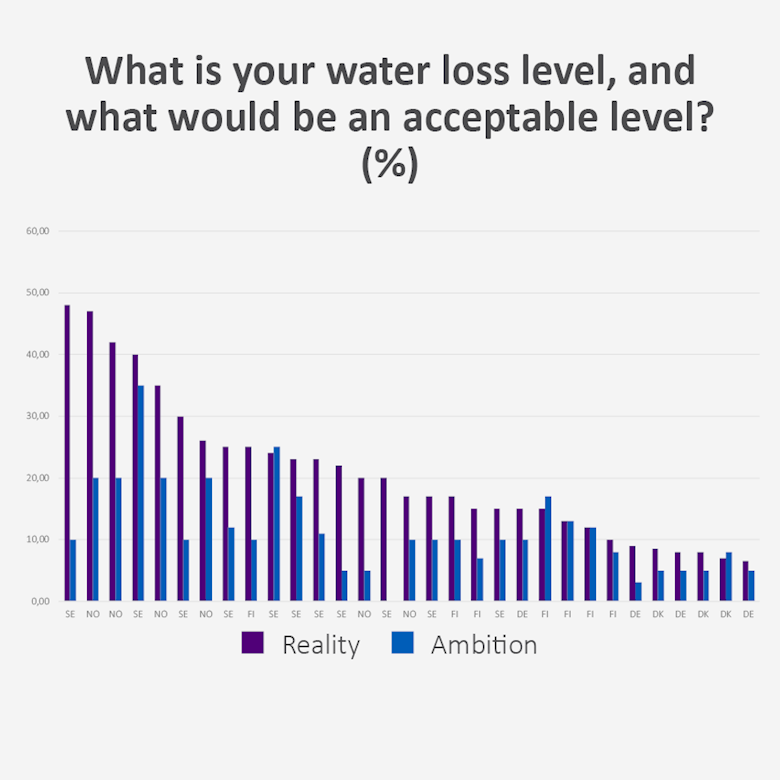
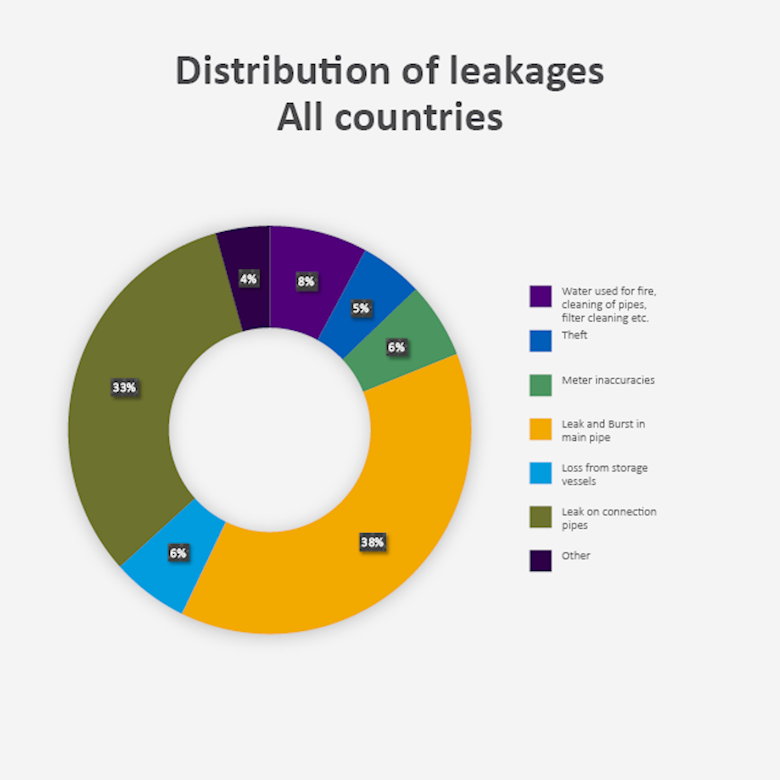
The NRW levels among the participating utilities varied greatly from just below 50% to around 6%, and almost all of the utilities have the ambition of lowering their current water loss. The big difference in water loss levels can be explained by a number of things such as current solutions, state or age of distribution network and legislative framework. As one example, utilities in Denmark are fined if their water loss exceeds 10% which has spurred increased investments and efforts into bringing the NRW down.If we look at the biggest sinner in terms of water loss, there is no surprise: 71 % of all water loss is caused by leakages across the distribution network. But what may come as a surprise to some, is where the leaks can be found. 38% of the water loss is created by leaks on distribution mains while 33% comes from leaks on service connections. In some cases, it is actually up to 50% of the water loss that comes from leaks in service connections.
Do you want to reduce your Non-Revenue Water?
With our solution that combines smart metering with acoustic leak detection, you can get an overview of possible leaks in service connections and distribution mains. The residential smart water meter, flowIQ® 2200 comes with built-in acoustic leak detection that monitors the acoustic noise in the adjacent pipes to locate possible leaks. This allows you to spend your time fixing the leaks rather than spending resources detecting them and lets you target your efforts where they matter the most.
You can also learn more about the different types of Non-Revenue Water (and how smart metering can help reduce them) in this blog post 6 kinds of Non-Revenue Waters and how to beat them with smart metering